How to Make AVG Curve with Ultrasonic Flaw Detector?
Ultrasonic flaw detectors are widely used in various industries to detect and analyze flaws in materials. One of the essential features of an ultrasonic flaw detector is the ability to generate an AVG (Amplitude vs. Gain) curve. This curve is crucial for accurately interpreting the ultrasonic signals and identifying flaws. In this article, we will discuss how to make an AVG curve with an ultrasonic flaw detector.
Firstly, it is important to understand the concept behind the AVG curve. The AVG curve represents the change in ultrasonic signal amplitude with respect to gain settings. By plotting the amplitude values at different gain levels, we can determine the optimal gain setting for flaw detection. This curve helps in achieving the best signal-to-noise ratio and identifying even the smallest flaws accurately.
To make an AVG curve, follow these steps:
1. Prepare the test specimen: Select a representative sample that closely resembles the material you want to inspect. Ensure that the specimen contains known defects or artificial reflectors of varying sizes and depths. These reflectors will help in calibrating the ultrasonic flaw detector and creating the AVG curve.
2. Calibrate the ultrasonic flaw detector: Connect the transducer to the flaw detector and adjust the settings to the recommended values. Use a calibration block with reference reflectors of known sizes and depths. Adjust the gain settings to obtain the desired signal amplitudes from the reference reflectors. This step ensures that the flaw detector accurately detects and measures the flaws.
3. Set the gain levels: Start with the lowest gain level and gradually increase it in small increments. For each gain level, measure the amplitude of the ultrasonic signal reflected from the artificial reflectors in the test specimen. Record the amplitude values corresponding to each gain level.
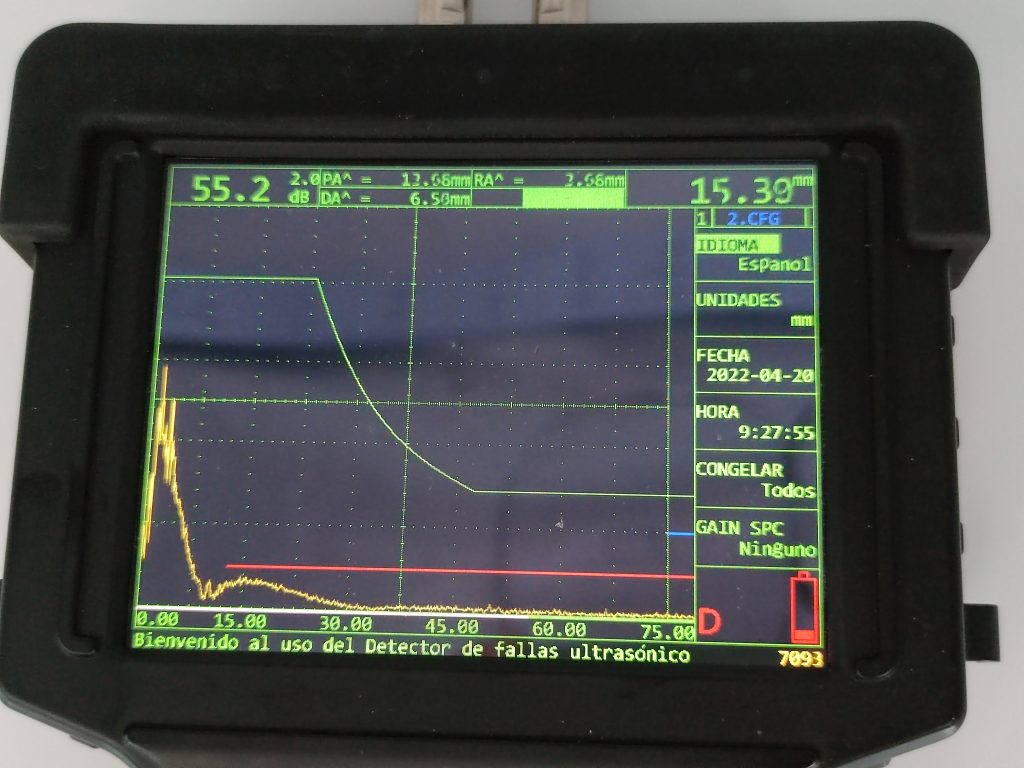
4. Plot the AVG curve: Once you have collected the amplitude values at different gain levels, plot them on a graph. The x-axis represents the gain levels, while the y-axis represents the corresponding amplitude values. Connect the plotted points to create the AVG curve.
5. Analyze the AVG curve: Examine the AVG curve to determine the optimal gain level for flaw detection. Look for a point on the curve where the amplitude values stabilize or reach a plateau. This point represents the gain level that provides the best balance between flaw detection and noise reduction.
By following these steps, you can create an AVG curve with an ultrasonic flaw detector. This curve will serve as a valuable reference for flaw detection in similar materials. Remember to repeat the process for different materials or thicknesses as each material may have different optimal gain settings. Regularly updating and maintaining the AVG curve will ensure accurate flaw detection and reliable inspection results.
In conclusion, understanding how to make an AVG curve with an ultrasonic flaw detector is essential for accurate flaw detection and analysis. By following the steps outlined above, you can create an AVG curve that will help in optimizing gain settings and improving flaw detection capabilities.